
Purdue Tops the Charts in In-State Minutes for 2024-25 Season
College basketball offers a wide range of statistics to analyze team performance. One interesting metric is the percent of in-state minutes played, highlighting how programs rely on local talent. We’re looking at the percentage of minutes played by players who were born in the same state in which their school is located.
According to ESPN.com data as of February 23rd, 2025, Purdue leads all teams with 67.35% of its minutes played by in-state players. As a proud Purdue alum, it’s exciting to see the program excel in developing and utilizing local talent.
Top Teams by Percent In-State Minutes
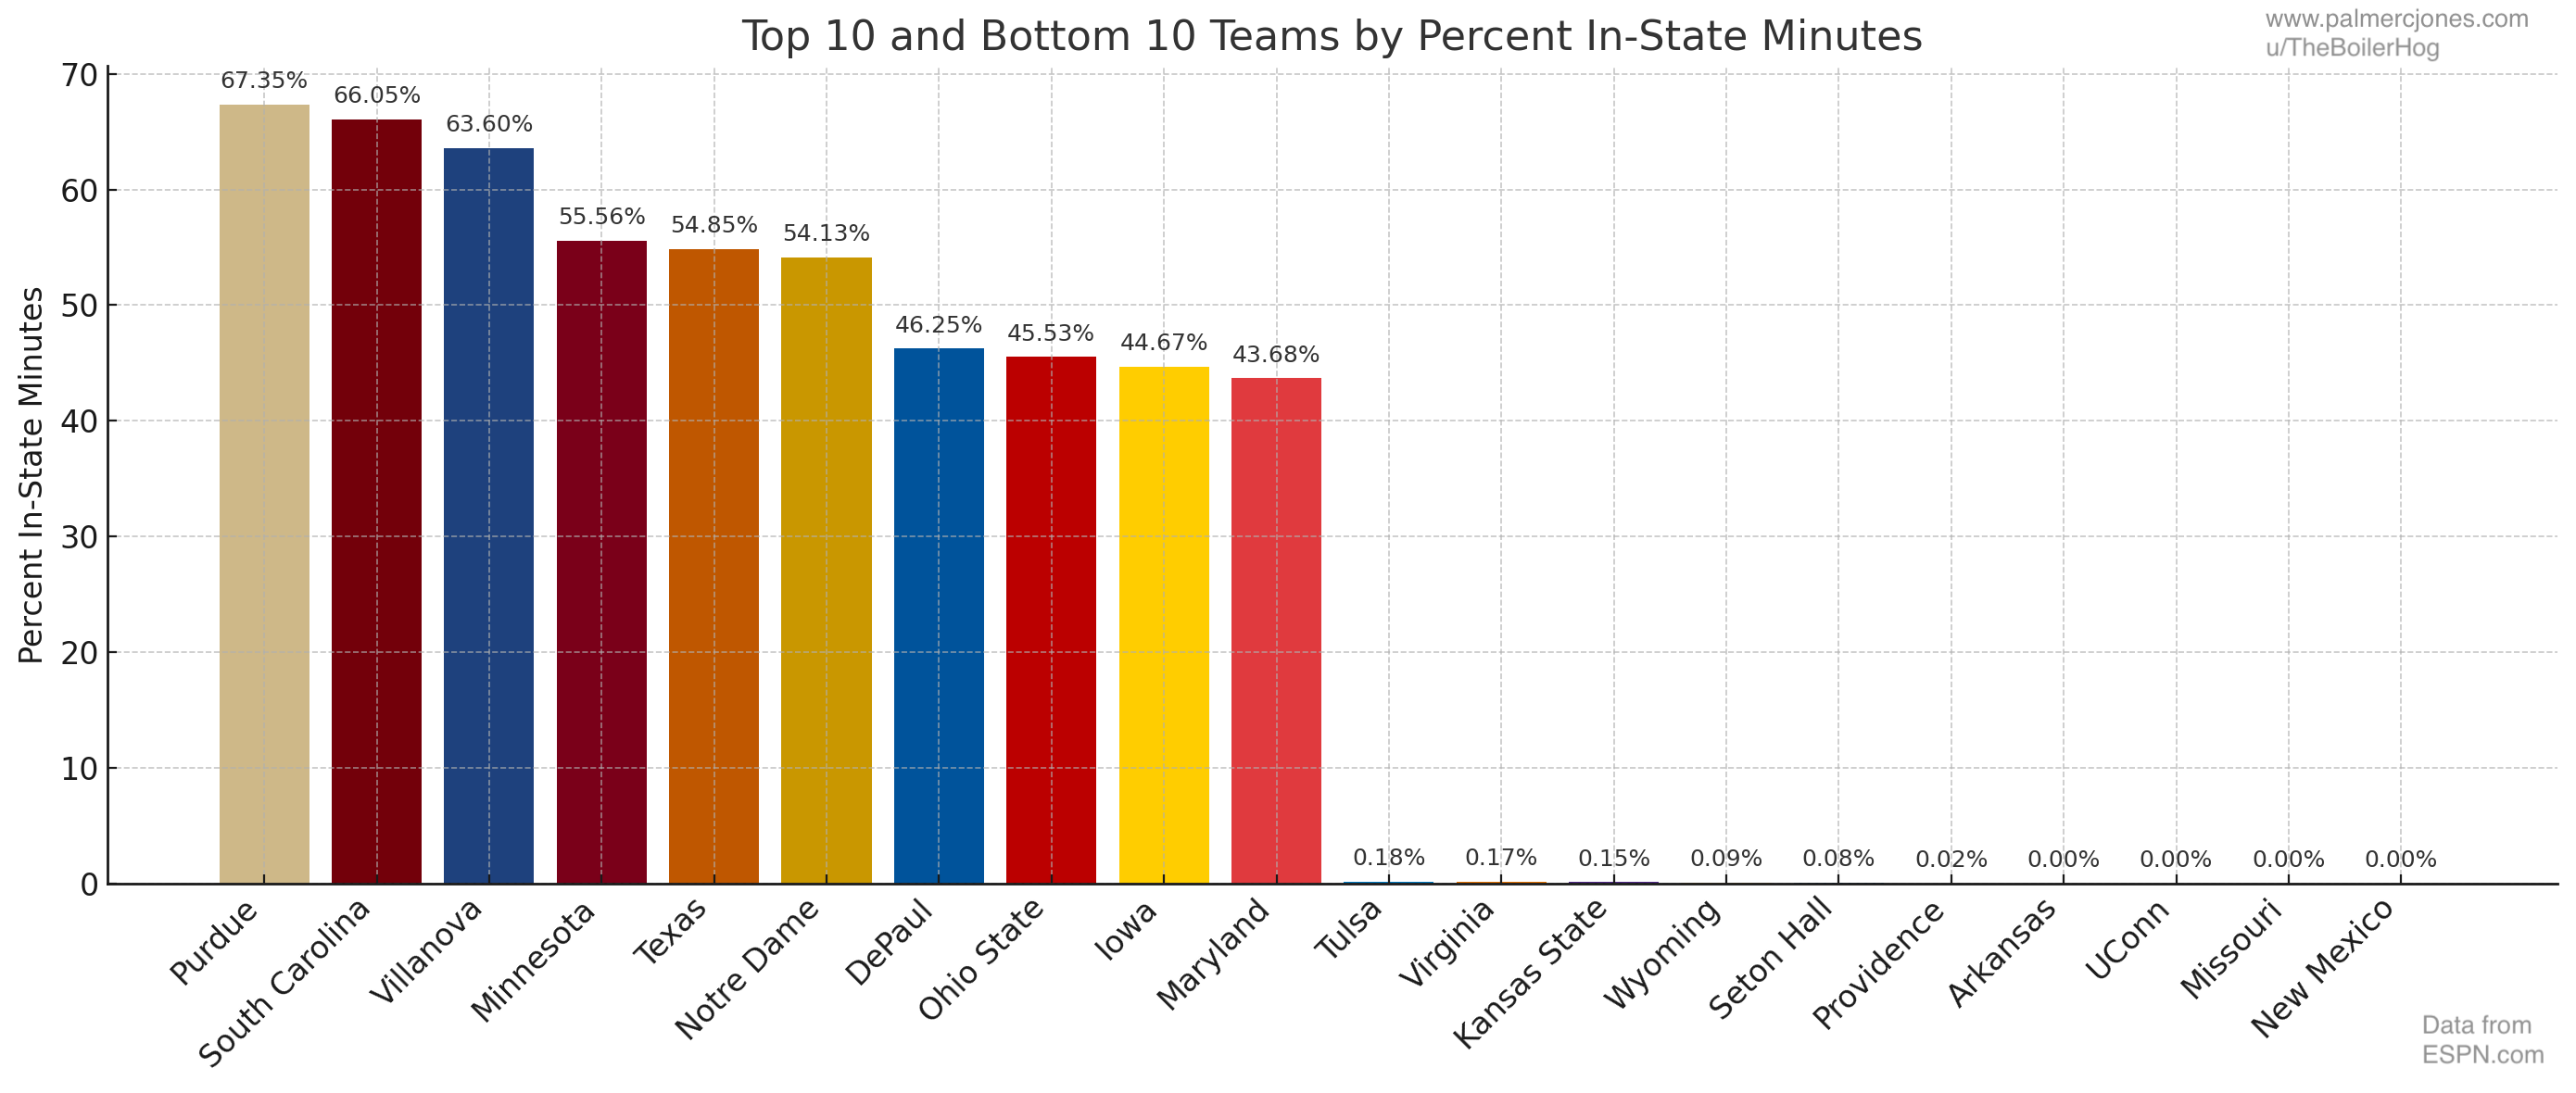
Following Purdue are South Carolina (66.05%), Villanova (63.60%), and Minnesota (55.56%). Programs like Texas (54.85%) and Notre Dame (54.13%) also show strong reliance on homegrown talent!
Broader Landscape: Major Programs Breakdown
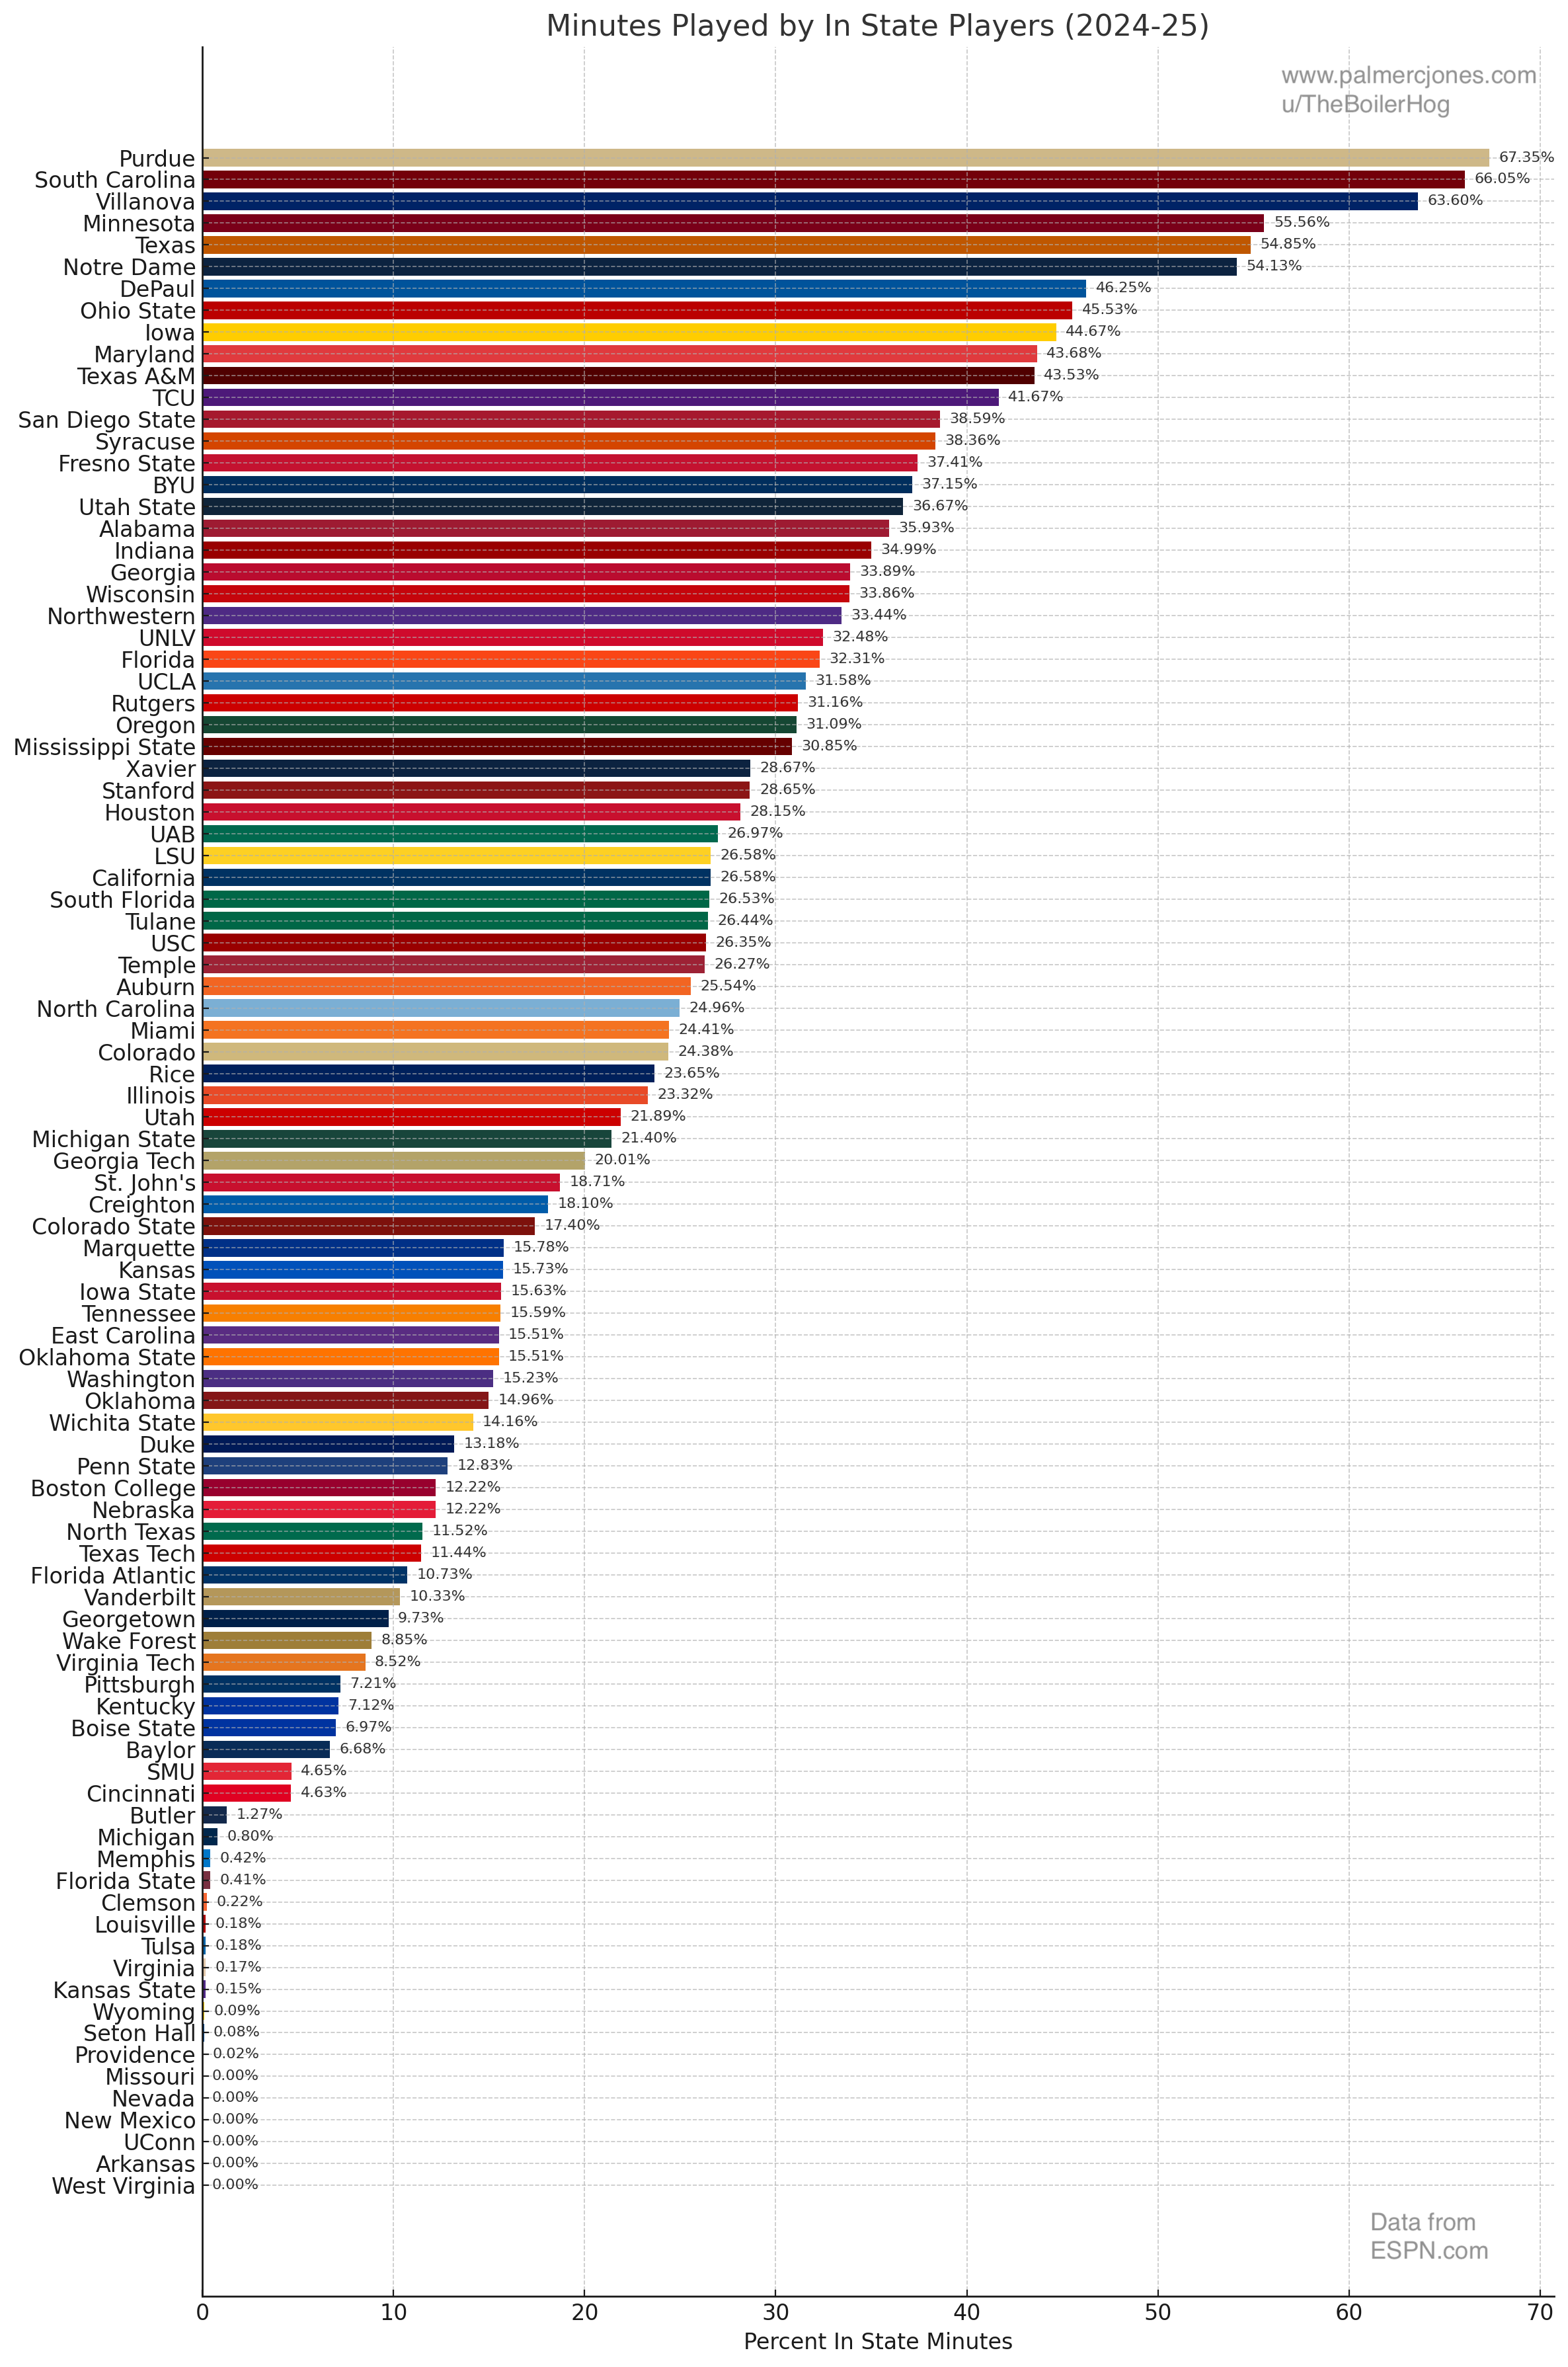
On the other end of the spectrum, some notable programs, including UConn, Missouri, Nevada, New Mexico, and West Virginia, recorded 0% in-state minutes.
Full Data Table: In-State Minutes Across All Teams
| Team Name | Conference | State | In State Minutes | Out of State Minutes | Total Minutes | Percent In State Minutes |
|---|---|---|---|---|---|---|
| Purdue | Big Ten Conference | IN | 3637 | 1763 | 5400 | 67.35% |
| South Carolina | Southeastern Conference | SC | 3599 | 1850 | 5449 | 66.05% |
| Villanova | Big East Conference | PA | 3562 | 2039 | 5601 | 63.60% |
| Minnesota | Big Ten Conference | MN | 3057 | 2445 | 5502 | 55.56% |
| Texas | Southeastern Conference | TX | 2962 | 2438 | 5400 | 54.85% |
| Notre Dame | Atlantic Coast Conference | IN | 2965 | 2513 | 5478 | 54.13% |
| DePaul | Big East Conference | IL | 2635 | 3062 | 5697 | 46.25% |
| Ohio State | Big Ten Conference | OH | 2504 | 2996 | 5500 | 45.53% |
| Iowa | Big Ten Conference | IA | 2423 | 3001 | 5424 | 44.67% |
| Maryland | Big Ten Conference | MD | 2369 | 3055 | 5424 | 43.68% |
| Texas A&M | Southeastern Conference | TX | 2350 | 3049 | 5399 | 43.53% |
| TCU | Big 12 Conference | TX | 2260 | 3164 | 5424 | 41.67% |
| San Diego State | Mountain West Conference | CA | 1949 | 3101 | 5050 | 38.59% |
| Syracuse | Atlantic Coast Conference | NY | 2118 | 3404 | 5522 | 38.36% |
| Fresno State | Mountain West Conference | CA | 2161 | 3615 | 5776 | 37.41% |
| BYU | Big 12 Conference | UT | 2034 | 3441 | 5475 | 37.15% |
| Utah State | Mountain West Conference | UT | 2054 | 3548 | 5602 | 36.67% |
| Alabama | Southeastern Conference | AL | 1949 | 3475 | 5424 | 35.93% |
| Indiana | Big Ten Conference | IN | 1828 | 3397 | 5225 | 34.99% |
| Georgia | Southeastern Conference | GA | 1830 | 3570 | 5400 | 33.89% |
| Wisconsin | Big Ten Conference | WI | 1837 | 3589 | 5426 | 33.86% |
| Northwestern | Big Ten Conference | IL | 1839 | 3661 | 5500 | 33.44% |
| UNLV | Mountain West Conference | NV | 1754 | 3646 | 5400 | 32.48% |
| Florida | Southeastern Conference | FL | 1745 | 3656 | 5401 | 32.31% |
| UCLA | Big Ten Conference | CA | 1705 | 3694 | 5399 | 31.58% |
| Rutgers | Big Ten Conference | NJ | 1698 | 3751 | 5449 | 31.16% |
| Oregon | Big Ten Conference | OR | 1756 | 3893 | 5649 | 31.09% |
| Mississippi State | Southeastern Conference | MS | 1682 | 3770 | 5452 | 30.85% |
| Xavier | Big East Conference | OH | 1562 | 3887 | 5449 | 28.67% |
| Stanford | Atlantic Coast Conference | CA | 1547 | 3853 | 5400 | 28.65% |
| Houston | Big 12 Conference | TX | 1555 | 3969 | 5524 | 28.15% |
| UAB | American Athletic Conf. | AL | 1409 | 3816 | 5225 | 26.97% |
| California | Atlantic Coast Conference | CA | 1448 | 3999 | 5447 | 26.58% |
| LSU | Southeastern Conference | LA | 1455 | 4020 | 5475 | 26.58% |
| South Florida | American Athletic Conf. | FL | 1446 | 4004 | 5450 | 26.53% |
| Tulane | American Athletic Conf. | LA | 1381 | 3843 | 5224 | 26.44% |
| USC | Big Ten Conference | CA | 1370 | 3830 | 5200 | 26.35% |
| Temple | American Athletic Conf. | PA | 1458 | 4092 | 5550 | 26.27% |
| Auburn | Southeastern Conference | AL | 1379 | 4021 | 5400 | 25.54% |
| North Carolina | Atlantic Coast Conference | NC | 1410 | 4240 | 5650 | 24.96% |
| Miami | Atlantic Coast Conference | FL | 1330 | 4119 | 5449 | 24.41% |
| Colorado | Big 12 Conference | CO | 1328 | 4120 | 5448 | 24.38% |
| Rice | American Athletic Conf. | TX | 1337 | 4316 | 5653 | 23.65% |
| Illinois | Big Ten Conference | IL | 1317 | 4331 | 5648 | 23.32% |
| Utah | Big 12 Conference | UT | 1143 | 4079 | 5222 | 21.89% |
| Michigan State | Big Ten Conference | MI | 1161 | 4263 | 5424 | 21.40% |
| Georgia Tech | Atlantic Coast Conference | GA | 1101 | 4400 | 5501 | 20.01% |
| St. John’s | Big East Conference | NY | 1024 | 4449 | 5473 | 18.71% |
| Creighton | Big East Conference | NE | 941 | 4259 | 5200 | 18.10% |
| Colorado State | Mountain West Conference | CO | 952 | 4519 | 5471 | 17.40% |
| Marquette | Big East Conference | WI | 856 | 4568 | 5424 | 15.78% |
| Kansas | Big 12 Conference | KS | 857 | 4592 | 5449 | 15.73% |
| Iowa State | Big 12 Conference | IA | 852 | 4599 | 5451 | 15.63% |
| Tennessee | Southeastern Conference | TN | 842 | 4559 | 5401 | 15.59% |
| East Carolina | American Athletic Conf. | NC | 853 | 4647 | 5500 | 15.51% |
| Oklahoma State | Big 12 Conference | OK | 838 | 4565 | 5403 | 15.51% |
| Washington | Big Ten Conference | WA | 826 | 4598 | 5424 | 15.23% |
| Oklahoma | Southeastern Conference | OK | 808 | 4593 | 5401 | 14.96% |
| Wichita State | American Athletic Conf. | KS | 743 | 4506 | 5249 | 14.16% |
| Duke | Atlantic Coast Conference | NC | 712 | 4690 | 5402 | 13.18% |
| Penn State | Big Ten Conference | PA | 718 | 4880 | 5598 | 12.83% |
| Boston College | Atlantic Coast Conference | MA | 681 | 4893 | 5574 | 12.22% |
| Nebraska | Big Ten Conference | NE | 666 | 4784 | 5450 | 12.22% |
| North Texas | American Athletic Conf. | TX | 576 | 4424 | 5000 | 11.52% |
| Texas Tech | Big 12 Conference | TX | 629 | 4870 | 5499 | 11.44% |
| Florida Atlantic | American Athletic Conf. | FL | 566 | 4709 | 5275 | 10.73% |
| Vanderbilt | Southeastern Conference | TN | 558 | 4842 | 5400 | 10.33% |
| Georgetown | Big East Conference | DC | 506 | 4693 | 5199 | 9.73% |
| Wake Forest | Atlantic Coast Conference | NC | 478 | 4922 | 5400 | 8.85% |
| Virginia Tech | Atlantic Coast Conference | VA | 460 | 4940 | 5400 | 8.52% |
| Pittsburgh | Atlantic Coast Conference | PA | 393 | 5057 | 5450 | 7.21% |
| Kentucky | Southeastern Conference | KY | 386 | 5039 | 5425 | 7.12% |
| Boise State | Mountain West Conference | ID | 378 | 5045 | 5423 | 6.97% |
| Baylor | Big 12 Conference | TX | 369 | 5158 | 5527 | 6.68% |
| SMU | Atlantic Coast Conference | TX | 251 | 5147 | 5398 | 4.65% |
| Cincinnati | Big 12 Conference | OH | 250 | 5151 | 5401 | 4.63% |
| Butler | Big East Conference | IN | 69 | 5359 | 5428 | 1.27% |
| Michigan | Big Ten Conference | MI | 42 | 5207 | 5249 | 0.80% |
| Memphis | American Athletic Conf. | TN | 22 | 5254 | 5276 | 0.42% |
| Florida State | Atlantic Coast Conference | FL | 22 | 5404 | 5426 | 0.41% |
| Clemson | Atlantic Coast Conference | SC | 12 | 5539 | 5551 | 0.22% |
| Louisville | Atlantic Coast Conference | KY | 10 | 5414 | 5424 | 0.18% |
| Tulsa | American Athletic Conf. | OK | 10 | 5690 | 5700 | 0.18% |
| Virginia | Atlantic Coast Conference | VA | 9 | 5390 | 5399 | 0.17% |
| Kansas State | Big 12 Conference | KS | 8 | 5217 | 5225 | 0.15% |
| Wyoming | Mountain West Conference | WY | 5 | 5617 | 5622 | 0.09% |
| Seton Hall | Big East Conference | NJ | 4 | 5271 | 5275 | 0.08% |
| Providence | Big East Conference | RI | 1 | 5424 | 5425 | 0.02% |
| Arkansas | Southeastern Conference | AR | 0 | 5400 | 5400 | 0% |
| UConn | Big East Conference | CT | 0 | 5500 | 5500 | 0% |
| Missouri | Southeastern Conference | MO | 0 | 5400 | 5400 | 0% |
| Nevada | Mountain West Conference | NV | 0 | 5450 | 5450 | 0% |
| New Mexico | Mountain West Conference | NM | 0 | 5452 | 5452 | 0% |
| West Virginia | Big 12 Conference | WV | 0 | 5500 | 5500 | 0% |
Final Thoughts
While this metric may not determine championships, it offers insight into recruiting strategies and local player development. For Purdue, leading in this category underscores the strength of basketball talent within Indiana. Go Boilers!
Comments